85% of the modules are made in China. The projects belong to no one Chinese.
The world's richest solar reserve has under 0.05% of its potential installed. The bottleneck is not the resource, not the cost — it is PLN's wallet, locked up by coal PPAs. The money sits in the segment that bypasses PLN: self-consumption on commercial & industrial rooftops.
Three Numbers
0.05%
So what: theoretical potential is ~3,200GW; cumulative installs by end-2025 were just 1.49GW. This “energy reserve vs. power deficit” mismatch is nearly unique among major economies — and the gap is not demand, it's the single buyer's financial constraint.
Sources: MEMR; PV Magazine, 2025–2026
85%
So what: Chinese Tier-1 makers (LONGi, Jinko, Trina, JA Solar) supply 85% of Indonesia's module imports, yet hold almost no share at the IPP/EPC level. Selling products needs no local relationships; building projects does — that gap is where the profit pool sits.
Source: Indonesia module import data, 2026. Compiled by Equator Creative.
<10%
Counter-evidence: PLN planned 777MW of utility solar for 2025 and delivered 75MW (50MW Nusantara + 25MW East Bali). Don't bet the utility-scale main line — betting on PLN means betting on a buyer locked into must-run coal PPAs.
Sources: PLN; PV Magazine, 2026
The Policy Map: how the window opened
Policy
Core content
Impact
MEMR 2/2024
Net metering abolished; quota system, 5.746GW total for 2024–2028
Rooftop logic shifts from “sell to PLN” to self-consumption
RUPTL 2025–2034
69.5GW of new capacity; 42.6GW renewable, 17.1GW solar
Solar becomes the largest increment source
MEMR 191/2024
TKDN local-content requirement cut to 20%
Sharply lowers the local-manufacturing bar
MEMR 11/2024
Further TKDN relief for projects COD before 2026-06-30 (PPA signed by 2025-12-31 + local-manufacturing pledge)
A defined window — with strings
100GW solar plan
80GW village microgrids (1MW × 80,000 villages) + 20GW other
Huge long-term demand, execution unclear
Sources: MEMR, PLN, Presidential Decree, 2024–2026. Compiled by Equator Creative.
Segments Today (as of end-2025)
Segment
Installed
Share
Growth character
Utility-scale
~600MW
40%
PLN planned 777MW for 2025, delivered 75MW — badly behind
C&I rooftop
~538MWp
36%
538.46MWp by Jul 2025, +8.78% m/m, 10,882 users — the hottest segment
Residential
~300MW
20%
Fragmented; mostly 3–5kW per household
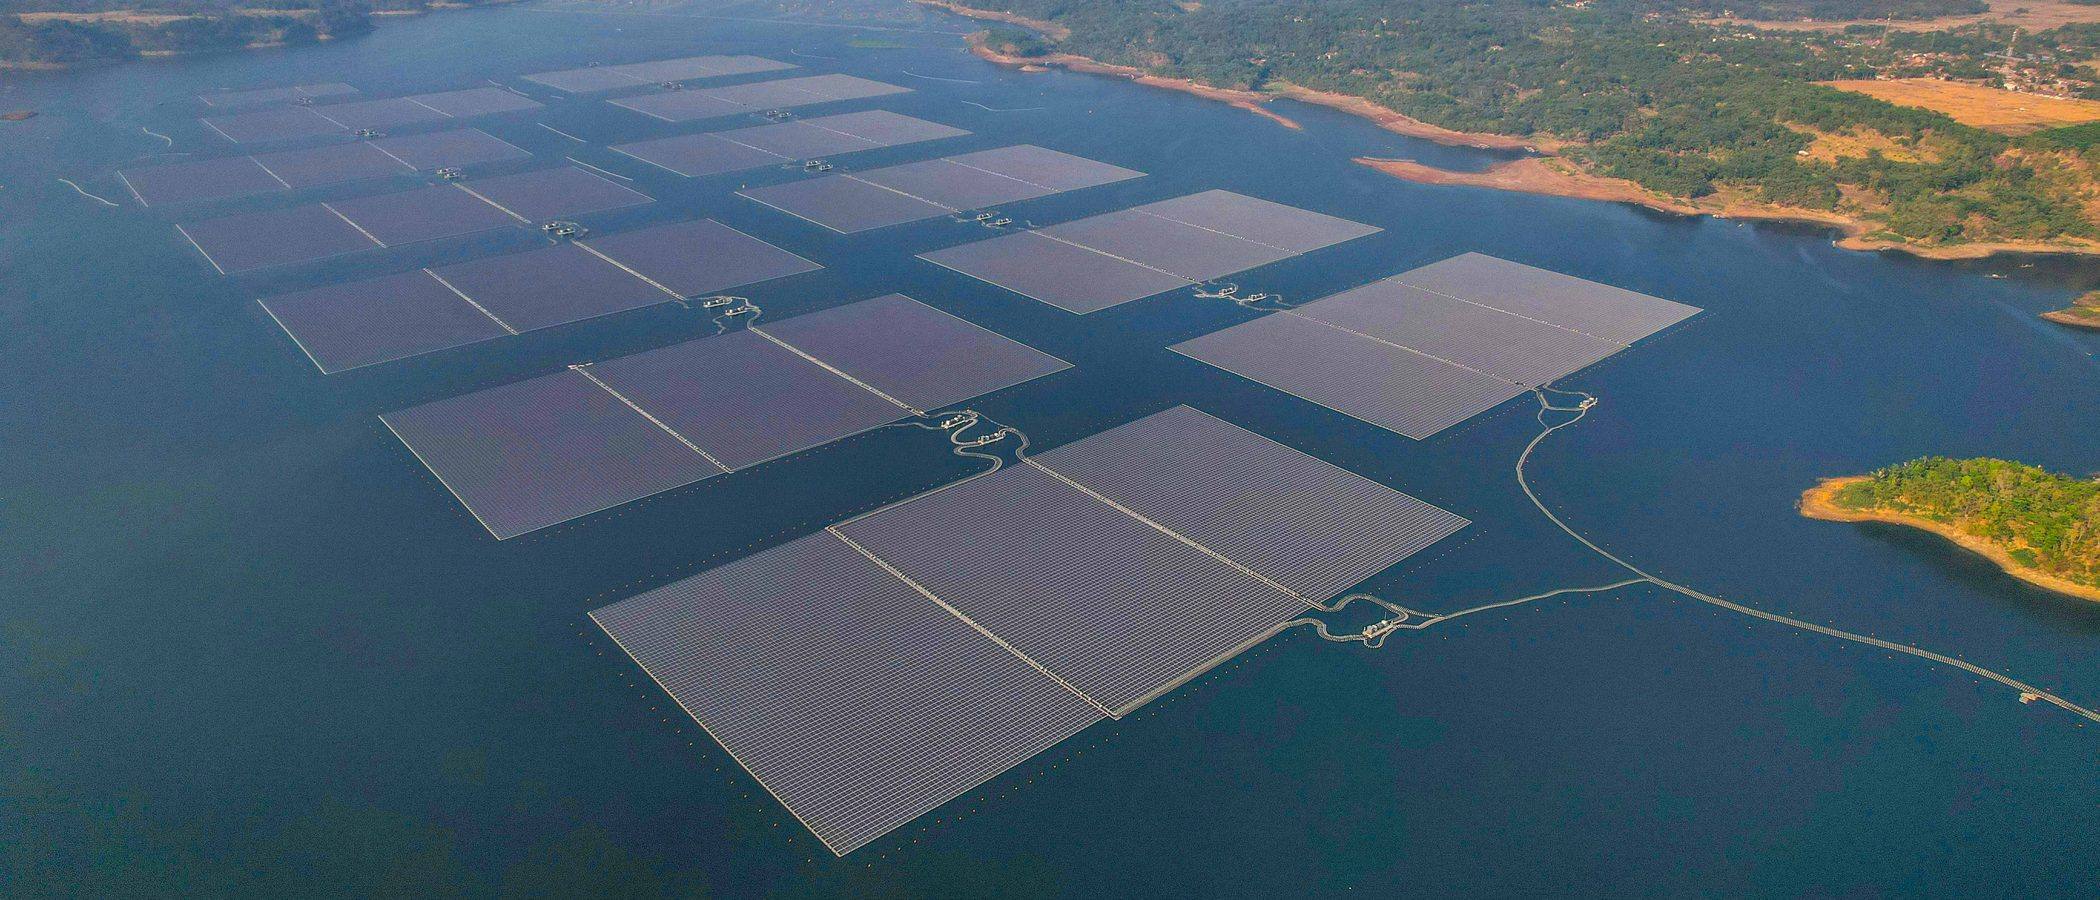
Floating
145MW
4%
Cirata 145MW is SEA's largest; Masdar expanding to 500MW
Sources: PV Magazine, PLN, Masdar, 2025–2026. Total installs forecast: 2.97GW in 2026, 14.91GW by 2031 (Research and Markets)
When This Verdict Breaks
① If quotas are not topped up after exhaustion (the 485MW released in Jan 2026 was fully taken by Apr 17, with a 200MW waitlist), the C&I window can freeze at any time — this path is only as durable as quota top-ups and the TKDN window. ② If TKDN snaps back to 40–60%, imported-module costs rise 15–25% and the asset-light export model breaks. ③ If you only make upstream polysilicon/wafers/cells, this report's entry paths do not apply.
Evidence & Action
The economics: net metering died, so why is demand still on fire?
Industrial tariffs on Java run IDR 1,400–1,800/kWh; solar LCOE is just IDR 862–1,099/kWh — self-consumption cuts 28–35% off the power bill. A 500kW system costs IDR 858 million (~USD 550k), pays back in 7.3–9.2 years, and at 40% leverage delivers an equity IRR of 23.7%. That is why killing net metering didn't kill demand: the money comes from displacing grid purchases, never from selling to PLN. System cost references: utility IDR 13,260/Wp, C&I rooftop 17,160/Wp, residential 21,840/Wp.
Sources: PLN tariffs; SUPRA International cost & LCOE data, 2026
The real bottleneck: not cost, not policy — PLN
Counterfactual: if PLN's finances weren't dragged by coal PPAs, it could free USD 0.5–1bn a year for renewable procurement, and utility-scale additions could reach 2–3GW annually — versus 75MW actually delivered in 2025, with project financing close rates under 30%. Rooftop solar grows precisely because it bypasses PLN: C&I users pay for it themselves. This also explains the player map: international IPPs (Masdar, ACWA, Vena) win with “sovereign cheap capital + government-to-government deals + 20–30-year PPAs”; local C&I developers (SUN Energy, SESNA, Solardex) win on “customer relationships + fast approvals + local financing”.
Source: Equator Creative, Indonesia Solar Industry Report, ch. 3–4, Aug 2026
Three Entry Modes
Mode
Investment
Payback
Risk
Best for
A · Asset-light agency
USD 0.5–1M
1–2 yrs
Low
Small/mid module makers testing the water
B · EPC + modules
USD 5–20M
3–5 yrs
Medium
Mid-size firms with EPC experience
C · Manufacturing + IPP
USD 50–200M
7–10 yrs
High
Tier-1 leaders like LONGi, Jinko
Source: Equator Creative, Indonesia Solar Industry Report §8.1, Aug 2026
The sweet spot: 100kW–2MW C&I rooftops. Indonesia's average C&I project is just 47kW; below 100kW is too fragmented and costly to acquire; 2–10MW faces fierce quota competition; above 10MW means PLN approvals and financing gates. The 100kW–2MW band concentrates customers (factories, warehouses, malls) with short decision chains, 7–9-year paybacks, and replicability. Core advice: enter with 500kW–2MW projects, target 50–100 projects a year (25–100MW), build local brand recognition, then move into utility IPP. Endgame probabilities: “China-style gradual upgrade” 50% (C&I EPC first, utility IPP second, local manufacturing last); “India-style policy swings” 30% (prepare a “formal compliance + substantive imports” hybrid); “Vietnam-style boom-bust” 20% (stay asset-light and flexible).
Source: Equator Creative, Indonesia Solar Industry Report §6.4, §8.2, Aug 2026
Opportunities by Priority (as of Aug 2026)
500kW–2MW C&I rooftop EPC + module bundles★★★
Proven self-consumption economics, no PLN in the loop, short decision chains — the most certain entry point. 50–100 projects a year builds local brand recognition.
Local alliances: EPC JVs + TKDN compliance nodes★★☆
Partner with or acquire local EPCs of the SUN Energy / SESNA / Solardex class; route TKDN compliance through PT Len's local assembly or JA Solar's Batang line — the window can shut any time, so move fast.
The floating-solar specialty★★
Cirata proved the model (145MW→500MW); Indonesia's reservoir resources are vast and competition is thin — a differentiated entry for firms with water-based PV experience.
Utility-scale IPP (the back hand)★★
Wait for JETP funding and PLN reform signals; if you play, buy political-risk insurance and pair with cheap capital (Eximbank, AIIB).
Residential installment finance★
A 5kW system costs just USD 5,583 — affordable to the middle class but with a 10.8-year payback. Whoever cracks installment finance unlocks a silent 20% of the market.
Red Lines
01
Betting the PLN main line2025 utility-solar delivery was under 10% of plan and payment delays are real — a state-owned signature is not risk-free
02
Treating TKDN relief as permanentThe cut is a tactical compromise to hit install targets; it can snap back to 40–60%, adding 15–25% to import costs
03
Reading Indonesia as cost-sensitiveIt is relationship-sensitive — local EPCs will pay 10–15% more for suppliers with local service
04
Outer islands without storageWeak grid absorption is a hard constraint — focus on the Java-Bali grid; storage is mandatory elsewhere
05
Vietnam-style rush-to-install thinkingIndonesia has no FIT, so no boom-bust arbitrage; steady self-consumption is the main battlefield
06
Unhedged FX exposureIDR depreciation risk is high — price contracts in USD and hedge with local financing
2-hour diagnosis
两小时诊断
Beyond the verdict: we help you decide your entry path. The first coffee is on us.
Data note: installation, tariff, cost and policy figures are drawn from MEMR, PLN, PV Magazine, SUPRA International, Research and Markets and company disclosures; verdicts and opportunity assessments are Equator Creative's independent analysis and do not constitute investment advice. Known blind spots: PLN's true financials, provincial grid absorption, and actual TKDN calculation methods.