Industrial Property Special · Sep 2026 · Layout V4
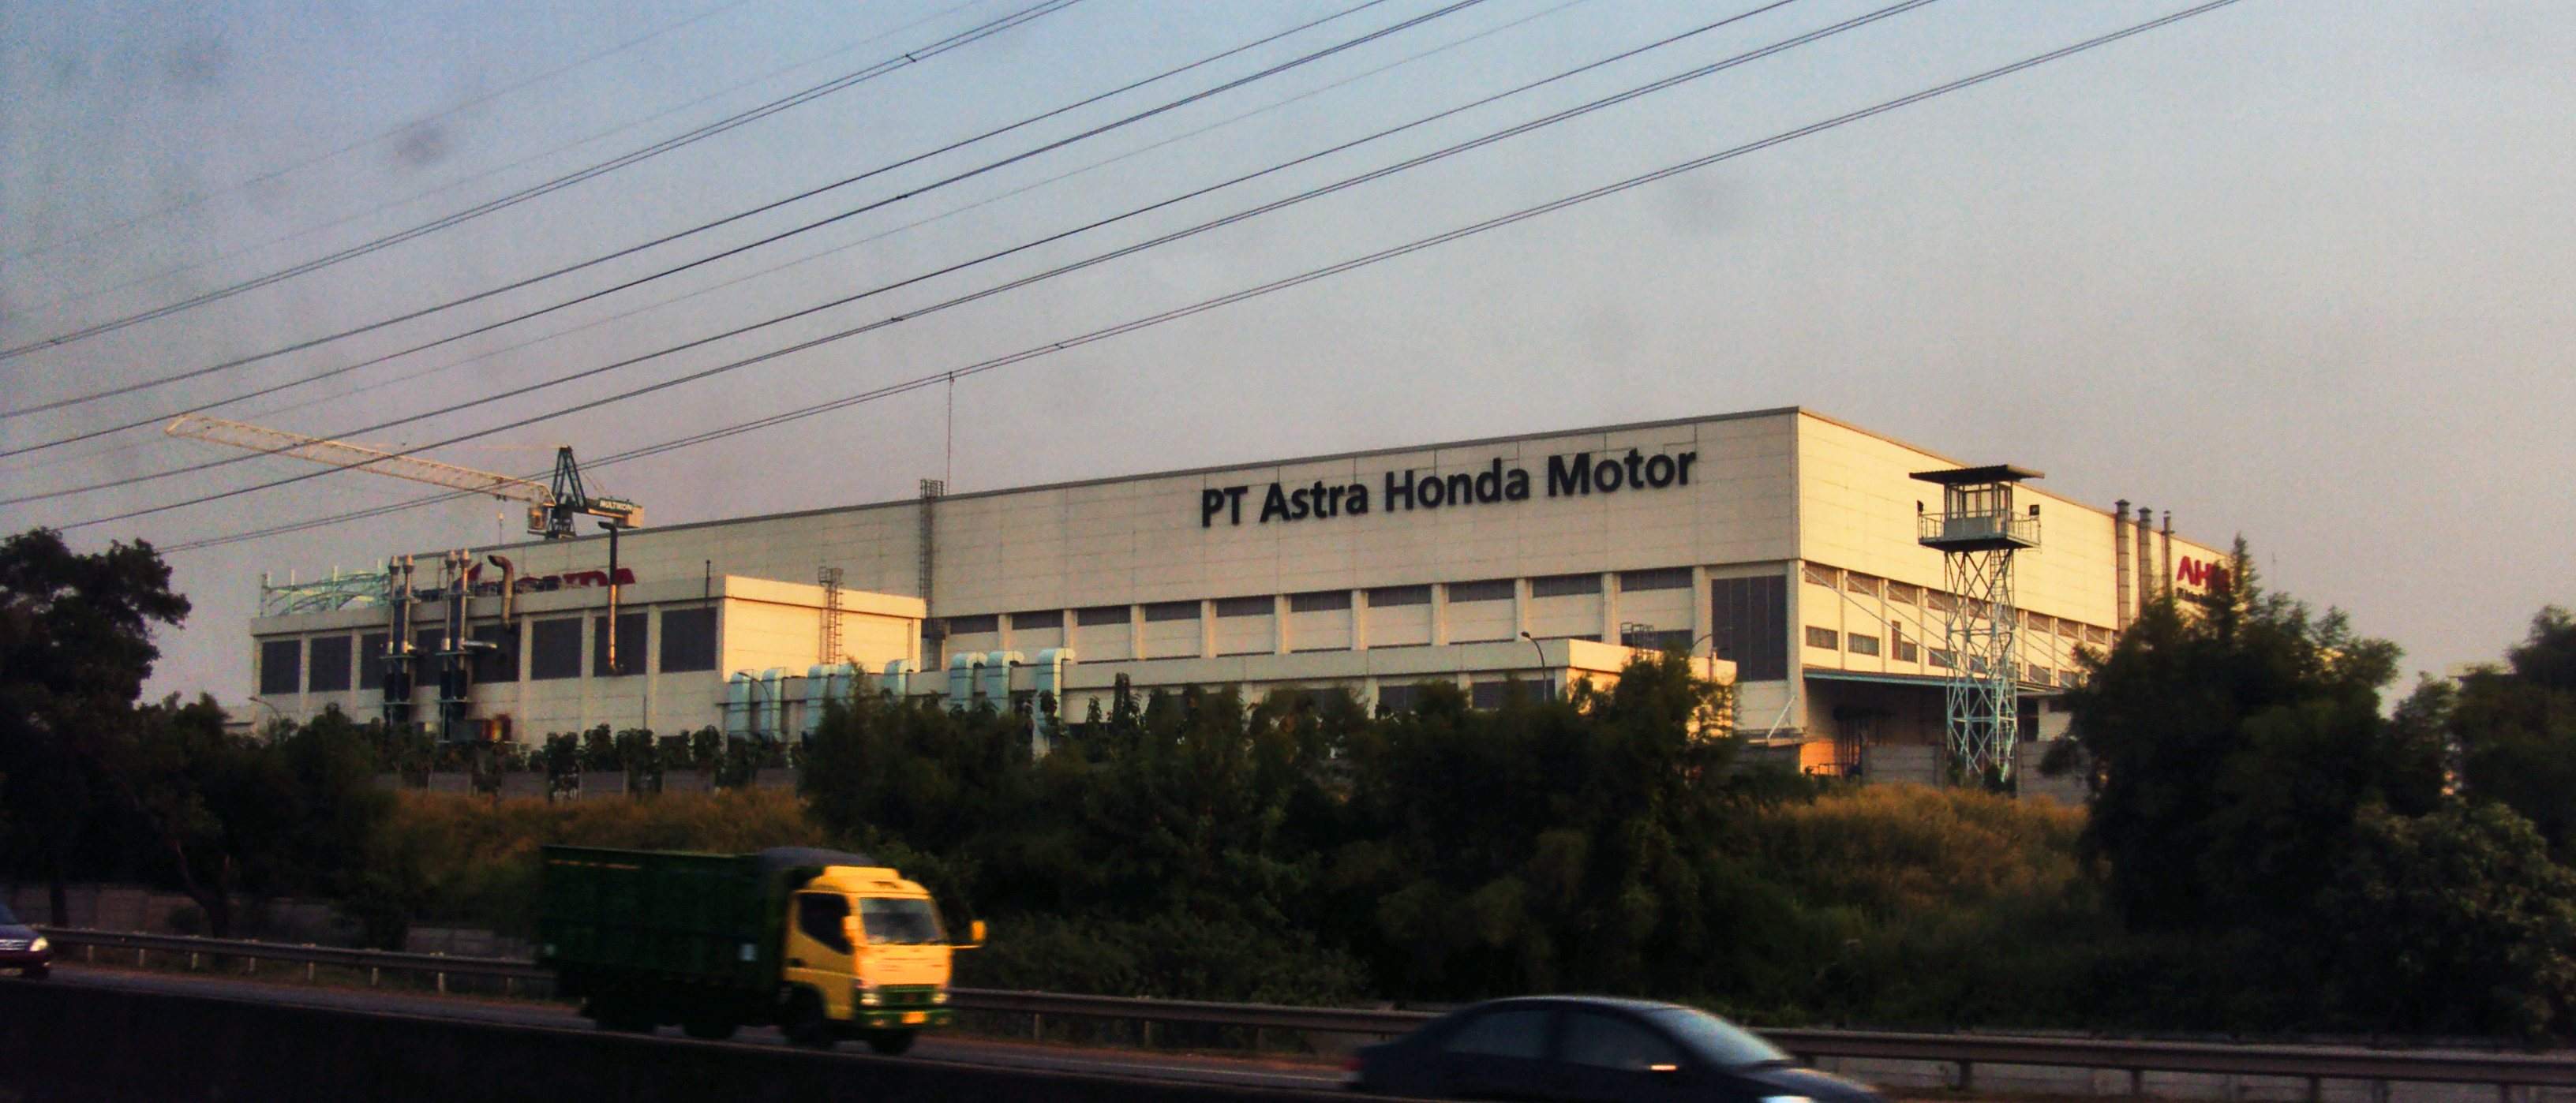
Photo: PT Astra Honda Motor plant, Karawang industrial corridor, West Java · by musnahterinjak · via Wikimedia Commons · CC BY-SA 3.0
This Month's Verdict
Industrial is the only asset class truly rising — but most of that 11.3% is an FX illusion
Of the three Greater Jakarta markets we track — malls, apartments, industrial — only industrial beat inflation: land prices rose 11.3% in a year and warehouse vacancy is just 8.1%, as manufacturing relocation and data centers bid for the same land. But Indonesian industrial land is quoted in US dollars and converted to rupiah: when the rupiah slides, the rupiah price “rises”. Read land prices in dollars first. For Chinese manufacturers, sequencing beats site selection — 91.9% warehouse occupancy says supply-chain demand is real, so lease a warehouse, prove out customs, logistics and labor, then buy land. BYD's 126-hectare plant has just opened in Subang; whether and how to follow is the next real question.
Three Numbers
+11.3%
So what: average industrial land hit IDR 3,053,000/sqm, up 11.3% in a year — the only one of the three markets (malls, apartments, industrial) to beat inflation. Demand has three faces: data centers and local investors buy the land; automotive, FMCG and logistics lease the warehouses. This market is not propped up by a single industry — which is exactly why it is stable.
Source: Cushman & Wakefield, Greater Jakarta Industrial MarketBeat Q2 2026
8.1%
So what: warehouse vacancy is just 8.1% (91.9% occupied), and Tangerang is down to 4.3% — there is no “cheap and good” warehouse left; good locations must be won. Your leverage in lease talks is not price but term and expansion rights: sign long to lock the rate, and write a first-refusal right on the adjacent unit into the contract.
Counter-evidence: in Subang, dollar-denominated land went from US$125 to US$150/sqm over six years — roughly 3% annualized. That is the real land-price curve; the rupiah “+11.3%” is mostly depreciation. The practical meaning: your land budget is in USD/RMB while your operating costs are in rupiah — a weaker rupiah doesn't hurt your land purchase and actually helps your operations.
Source: estate developer Suryacipta public statement (Kontan, Mar 2026), verified Sep 2026
The market in six numbers
Scope note: the Greater Jakarta industrial market runs on two tracks — industrial land (buy to build) and leased warehouses (rent to turn inventory). The first decides where your capacity sits for the next decade; the second decides where this quarter's goods sleep. Macro backdrop: Indonesia 2026 GDP growth 5.2%, inflation 3.34%, central bank rate 5.75% (Bank Indonesia and BPS figures, as cited by the source report).
Metric
Q2 2026
YoY
Plain reading
Total industrial land stock
16,689 ha
——
The total estate pipeline around Greater Jakarta
New land supply this quarter
40 ha
——
All in Purwakarta — development keeps pushing east
Land absorption this quarter
37.9 ha
——
Data centers buy hardest, then local investors
Land sales rate
63.84%
vs 61.1% historical avg
Land is selling faster than the ten-year average
Average land price
IDR 3,053,000 /sqm
+11.3%
The only segment beating inflation — mostly an FX effect
Average warehouse rent
IDR 81,795 /sqm/mo
+2.5%
Rising too, but gently
Source: Cushman & Wakefield, Greater Jakarta Industrial MarketBeat Q2 2026.
When This Verdict Breaks
① This report relies on a single agency's dataset (Cushman & Wakefield), verified as of Sep 21, 2026 — re-verify against the latest quarter before signing. ② If the rupiah appreciates sharply, or manufacturing relocation and data-center demand cool, the “only truly rising asset” verdict must be revisited. ③ “Lease before you build” and “power before price” are advisory judgments, not statistics in this report. ④ This report is a business reference, not legal or investment advice — before any land purchase, title (HGB), building permit (PBG) and environmental permit (AMDAL) must be verified by a licensed Indonesian legal adviser.
Evidence & Action
The land map: choosing among seven submarkets
One-line guidance: for mature infrastructure, Bekasi (but it is nearly sold out); for the main battlefield, Karawang–Purwakarta (top absorption this quarter, and where new supply landed); to bet on the next decade, Subang — that's where BYD is.
Submarket
Stock (ha)
Q2 absorption (ha)
Sales rate
Land price (IDR/sqm)
Equator note
Bekasi
5,836
9.84
80.5%
3,210,000
The mature corridor, nearly sold out — move fast, but no longer cheap
Karawang & Purwakarta
5,462
16.67
52.2%
2,800,000
Top absorption and new supply this quarter — the current main battlefield
Tangerang
804
3.00
69.9%
3,441,667
Priciest land citywide; close to Jakarta and the port — suits high-turn logistics
Subang
80
8.40
27.0%
2,200,000
New estate, BYD just landed — infrastructure immature, but the anchor tenant has arrived
Serang
3,338
0
50.9%
2,200,000
West line, zero deals this quarter — watch and wait
Bogor
80
0
84.8%
2,300,000
Tiny market, essentially sold out
Jakarta
1,089
No primary deals
——
——
No new land to discuss inside the city
Source: Cushman & Wakefield Q2 2026 industrial land statistics.
The warehouse map: lease first, then talk about building
Q2 added 93,618 sqm of leased warehouse stock (mostly in Bekasi); citywide stock is about 3.28mn sqm with 91.9% occupancy. An 8.1% vacancy rate means no “cheap and good” warehouses — good locations must be won, and Tangerang vacancy is already down to 4.3%.
Submarket
Stock (sqm)
Vacancy
Rent (IDR/sqm/mo)
Equator note
Bekasi
1,790,805
8.2%
81,040
Half the city's warehouses are here, with the most new supply — choice exists, so negotiate
Jakarta
500,148
8.6%
102,250
Priciest rent citywide — you're paying for proximity to the market
Karawang & Purwakarta
451,777
8.1%
77,000
Warehouses follow factories — manufacturing support stock
Lowest vacancy citywide — good warehouses must be won
Citywide
~3.28mn
8.1%
81,795
91.9% occupancy — supply-chain demand is real
Source: Cushman & Wakefield Q2 2026 warehouse statistics (the source report's body text gives 3,281,581 sqm vs 3,281,199 sqm in its tables — a minor scope discrepancy; we write “~3.28mn sqm”).
The cost ledger: what land and warehouses really cost
FX follows the source report at IDR 17,917/USD; RMB converted at ~7.1 per dollar. Watch the second row: Subang land rose from US$125 to US$150 over six years — ~3% annualized. That is the real dollar-denominated curve; the rupiah “+11.3%” is mostly depreciation.
Item
Unit price
Plain ledger
Industrial land (citywide avg)
IDR 3,053,000 /sqm ≈ US$170 /sqm
≈ RMB 1,210/sqm, ~RMB 810k per mu (1 mu ≈ 666.7 sqm)
Industrial land (Subang case)
~US$150 /sqm (estate list price)
Up from US$125 in 2020 — about +20% over six years in dollar terms, ~3% annualized
Warehouse lease (citywide avg)
IDR 81,795 /sqm/mo ≈ US$4.6 /sqm/mo
A 1,000 sqm standard warehouse runs ~RMB 32k/month
Reference: BYD Subang plant
126 ha, IDR 11.7tn invested
≈ RMB 4.6bn, 150k vehicles/year capacity, opened Sep 3, 2026
Sources: Subang land price from estate developer Suryacipta's public statement (Kontan, Mar 2026); BYD figures from public reports (MarkLines, Liputan6 and others, verified Sep 2026 — investment quoted at the official IDR 11.7tn inauguration figure).
Five Actions for Management
Lease a warehouse and prove the supply chain before buying land★★★
“Good asset” is not “buy now”. Lease first and run customs, port, trucking and labor for real; validate your Indonesia model on six months of data, then decide where the land goes. A wrong plot is a ten-year problem; a wrong lease is a six-month one.
Due diligence starts with power, not price★★★
Data centers were the most aggressive land buyers this quarter — they outbid and outpay you, and worse, they book the estate's power capacity first. Planned capacity, available capacity, dual-circuit supply, industrial tariff: until all four are confirmed, cheap land is dead land. “Planned power” is not “power available when you build”.
Subang is a signal, not an answer★★☆
BYD's 126-hectare, 150k-unit plant opened in Subang on Sep 3 — suppliers following the OEM will see an ecosystem forming. But estate sales are only 27%, supporting infrastructure is far from ready, and the Patimban port link road opens only in 2027: right for suppliers taking an ecosystem slot next to the anchor tenant, wrong for anyone needing mature infrastructure to start immediately. Betting on Subang is betting on 2028 and beyond, not next year.
TKDN is a hidden land tax — put it in the factory model★★
Localization requirements are hardening: for EVs, local content (TKDN) is 40% in 2026, 60% for 2027–2029, and 80% by 2030. Local supply-chain compliance is a hard line item — it buys tax breaks and market access, but only if your model admits it exists.
Run the port math separately★★
Jakarta's Tanjung Priok is chronically congested; Patimban is the long-term answer for the eastern corridor (Subang direction), but its link road opens only in 2027. Which port your cargo uses decides which corridor your warehouse and plant belong in.
Red Lines (six operating boundaries)
01
Foreign buyers must use a PT PMA holding HGBLand must be held by the company under HGB (Right to Build) — industrial land in a personal name cannot be titled
02
The estate due-diligence trio is all-or-nothingTitle (clean HGB), building permit PBG (formerly IMB), environmental permit AMDAL — paying a deposit off a brochure is clearing someone else's mines
03
KEK incentives are not automaticTax breaks hinge on industry, investment size and jobs commitments — have your adviser check your KBLI code against the incentive list before signing; verbal promises don't count
04
Power before priceDual circuit, available capacity, expansion timeline, industrial tariff — without all four, cheap land is dead land
05
The port decides the corridorTanjung Priok is congested; Patimban's link road opens 2027 — your cargo's port picks your corridor
06
Don't copy your China labor modelMinimum wages rise annually, unions are active, severance is statutorily expensive — budget labor as “wages + benefits + severance reserve”, not salary times headcount
2-hour diagnosis
两小时诊断
A factory is a ten-year decision — worth two hours to get the math right first. Site comparison, estate due-diligence checklist, plant cost model: bring your project. The first coffee is on us.
Data note: this report is Equator Creative Consulting's Chinese-language interpretation of Cushman & Wakefield's MarketBeat: Greater Jakarta Industrial Q2 2026; underlying data copyright belongs to Cushman & Wakefield. Macro figures are cited by that report from Bank Indonesia and BPS. BYD plant and Subang land-price information comes from public reports (MarkLines, Liputan6, Kontan, CNBC Indonesia and others), verified Sep 21, 2026; reported BYD investment figures vary (IDR 11.7tn–16tn, the latter including the supporting ecosystem) — we use the official IDR 11.7tn inauguration figure. FX: IDR 17,917/USD (source report); RMB at ~7.1 per dollar. This is a business reference, not legal or investment advice.