
12.003 亿次
2025 年国内旅游行程。行程不是去重游客人数。BPS
 赤道创意咨询管理Equator Creative Consulting
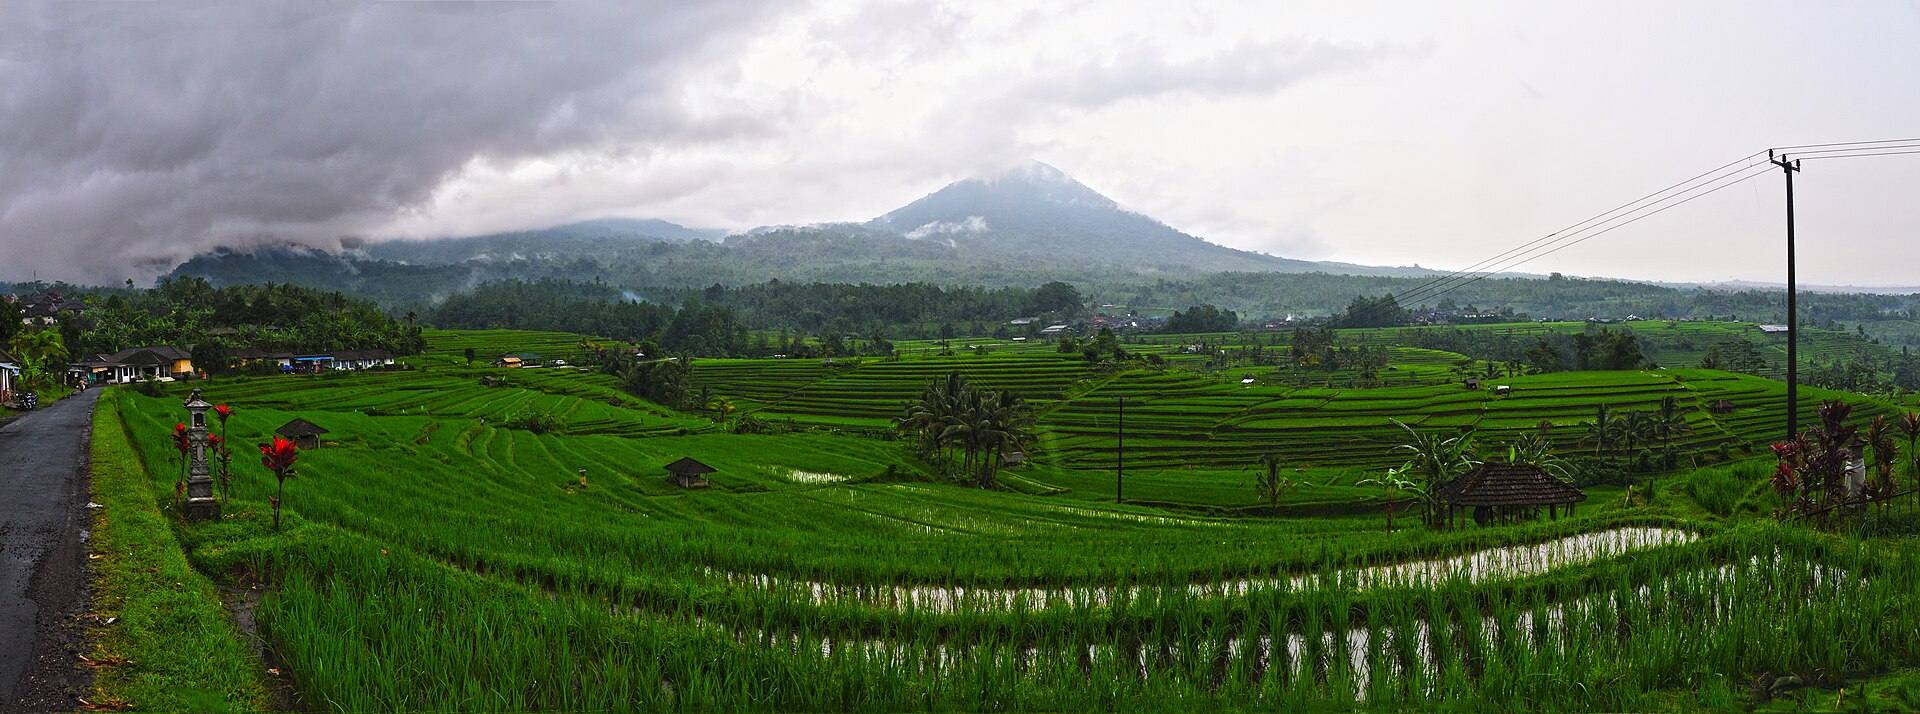
图片:chensiyuan / Wikimedia Commons,CC BY-SA 4.0,已裁切。图片来源及许可
印尼旅游不是单一的“国际游客生意”:国内高频出行构成产业体量,入境游带来跨境客源,流量又集中经过少数航空与海上门户。中国旅行社、OTA、目的地管理公司(DMC)及旅游服务商,应把航线、目的地、地接履约和单团经济账连起来。
2025 年国内旅游行程。行程不是去重游客人数。BPS
2025 年国际游客入境记录;不等同去重人数或旅行团订单。BPS
报告截点前最新月报:入境 160 万次、国内行程 1.043 亿次、星级酒店入住率 52.52%。
2025 年印尼国内旅游行程约 12.003 亿次,同比增长 17.55%;国际游客入境记录约 1,538.7 万次,同比增长 10.8%。BPS 旅游卫星账户(TSA)估算,境内旅游消费 Rp2,408.97 万亿,其中国内游客消费 Rp2,090.31 万亿、入境游客消费 Rp318.66 万亿;旅游直接 GDP 为 Rp1,138.90 万亿、占 GDP 4.78%。它们是不同统计维度,不能把国内行程与国际入境记录相加成游客总人数。[1–4]
| 指标 | 2025 数值 | 商业读法 | 不能推出 |
|---|---|---|---|
| 国内旅游行程 | 12.003 亿次 | 本地交通、景点、住宿、餐饮与假日产品的需求底盘。 | 不是 12 亿名游客,也不直接代表外国客源机会。 |
| 国际游客到访 | 1,538.7 万次 | 拆分客源国、口岸与目的地以测航线和地接承载。 | 不是去重游客或旅行团订单数。 |
| 境内旅游消费 | Rp2,408.97 万亿 | 国内消费约占 86.8%,入境游客消费约 13.2%。 | 不是旅行企业可直接取得的收入。 |
| 旅游直接 GDP | Rp1,138.90 万亿;4.78% | BPS TSA 直接贡献口径。 | 不可与包含间接/诱发影响的 WTTC 估算相加或视作同口径。 |
BPS 于 2026-10-01 发布 8 月月报:国际到访 160 万次、国内行程 1.043 亿次、星级酒店入住率 52.52%;它取代 7 月成为本报告截点的最新月报。[4]
商业含义:服务印尼居民,应围绕本地出行频率、价格承受力、城市群和季节性设计;服务中国出境客,应围绕航线、入境信息、中文客服、地接和目的地组合设计。两类客源不能套用同一获客和毛利模型。
BPS 2025 国籍拆分中,中国来源地入境约 134 万次,占国际到访约 8.7%,排名第四。BPS 离境调查估计,中国来源地每次到访平均支出约 US$1,213,国际游客总体约 US$1,267;平均停留期分别约 22.50 天和 9.92 天。[2][5][6]
较长平均停留期与略低于总体的单次支出同时出现,说明国籍统计可能混有商务、探亲、长住及休闲客,不能拿它推算短期团客规模或每团收入。均值也不代表每位旅客。
Dragon Trail 于 2026 年 8 月调查 1,010 名中国大陆受访者:54% 表示计划在中秋及国庆假期出境;有家庭同行者中,70% 倾向团队、私家团、半自助或邮轮等组织化方式。这是中国出境意向调查,不是印尼目的地样本,也不是实到/订单数据。[7]
把休闲、商务、探亲需求拆开;按真实订单核验渠道、行程、停留和每人收入。先试 2–3 条线路,再按转化、退款、履约成本和复购决定扩量。
2025 年三大国际入口为巴厘岛伍拉·赖机场、雅加达苏加诺—哈达机场和巴淡岛,分别约 690.8 万、276.1 万、159.4 万次,合计约占全国 73.2%。入口只说明从哪里进入,不等于最终过夜或消费地点。[2]
| 门户与延伸目的地 | 可测试产品 | 履约检查 |
|---|---|---|
| 巴厘岛 | 度假、婚礼庆典、康养、海岛与文化体验;按客群、酒店档次拆产品。 | 旺季房量、接送、景点时段、海况与取消安排。 |
| 雅加达 | 商务会奖、城市短停、商务访问后延伸爪哇文化线。 | 交通耗时、商务行程冲突、展会房价波动。 |
| 巴淡—民丹 | 新加坡/马来西亚联程、短假及海岛度假。 | 渡轮班次、边检衔接、跨境延误与运营商责任。 |
| 日惹—婆罗浮屠、东爪哇、龙目岛、科莫多、托巴湖、拉贾安帕特 | 遗产、自然、潜水和深度长线,作为门户延伸。 | 国内航班缓冲、保护区规则、天气及医疗撤离。 |
BPS 全国口岸系列的 Ngurah Rai 为 6,907,585 次;BPS 巴厘省级年表的直达巴厘外国游客为 6,948,754 次。两系列分列引用,不相加、不强行调平。[2][8]
按客源城市、航线、旅期和预算测试巴厘岛单目的地及“雅加达/日惹+巴厘岛”联线。先用固定日期、少量酒店和可替代活动控制风险。
销售稳定交付:统筹中文材料与库存,标准化车辆、导游、餐饮、景点、确认/变更/退款时限和事故响应。
先验证搜索、内容互动到询价的漏斗,再把接送、门票、活动、酒店与一日游做成可交付 SKU,并将评价和履约数据用于供应商筛选。
为中国渠道提供可售库存、结算、中文服务、团体政策和取消条件;以净价或联合营销试新增客源,不按国籍总量承诺保量。
国家平均支出不是旅行社收入。每条线路按真实报价核算净收入(扣优惠、退款、手续费、税费)、住宿与地接变动成本、佣金和风险准备;计算每人贡献毛利、盈亏平衡人数、可售座位收入、取消率、准点率、投诉率及复购。分别压测淡旺季、汇率变化和未满团。只有退款与履约成本后仍有正贡献,且当地伙伴兑现服务,才扩投。
| 阶段 | 动作 | 验收材料 |
|---|---|---|
| 第 1–2 周 | 选 2 个客群、最多 3 条线路;核对入境要求、航线/渡轮、季节和景区规定;收至少 3 家书面报价。 | 线路卡、成本底表、备用交通/供应商。 |
| 第 3–6 周 | 审核 DMC、酒店、活动方;走通接送、住宿、导览、支付、变更、投诉与库存确认。 | 服务标准、退款条款、中文客服 SOP、应急联系人。 |
| 第 7–12 周 | 小规模试销;周度复盘询单—下单—出行漏斗及单团贡献毛利,访谈成交与流失客户。 | 验证结果、修正假设、扩量或暂停决定。 |
截点 2026-10-03。8 月是当时最新 BPS 全国月报;全年 2026 数据尚未公布。国际到访不是去重人数,国内旅游行程也不是去重人数;离境调查为样本估计,不是产品收入预测。
本文为一般行业研究,不构成法律、税务、投资或经营意见,也不确认任何旅行社、地接社、酒店或服务商的资质与表现。引用数据前请核对原始口径、期间与范围,不可将市场总量直接转化为企业收入预测。正式经营以印尼现行法规、合同与专业顾问意见为准。
Photo: chensiyuan / Wikimedia Commons, CC BY-SA 4.0, cropped. Source and license
Indonesia tourism is not a single international-visitor business. Frequent domestic trips underpin sector scale; inbound travel brings cross-border demand; and visitor flows pass through a few air and sea gateways. Chinese operators, OTAs, DMCs and travel services need to connect air access, destinations, local delivery and group economics.
Domestic tourism trips in 2025, not unique people. BPS.
International arrivals in 2025; not unique tourists or tour bookings. BPS.
Latest monthly release by this report’s cut-off: 1.60m arrivals, 104.30m domestic trips, 52.52% star-hotel occupancy.
In 2025, Indonesia recorded about 1.2003bn domestic tourism trips (+17.55%) and 15.387m international arrivals (+10.8%). BPS’s Tourism Satellite Account (TSA) estimates tourism consumption at IDR 2,408.97tn: IDR 2,090.31tn by domestic visitors and IDR 318.66tn by inbound visitors. Direct tourism GDP was IDR 1,138.90tn, or 4.78% of GDP. These are different measures; do not add trips and arrival records as people. [1–4]
| Measure | 2025 | Commercial reading | Does not imply |
|---|---|---|---|
| Domestic trips | 1.2003bn | Base for domestic transport, attractions, stays and holidays. | Unique people or direct inbound demand. |
| Inbound arrivals | 15.387m | Segment source markets, gateways and destinations. | Deduplicated travelers or tour bookings. |
| Tourism consumption | IDR 2,408.97tn | Domestic visitors about 86.8%; inbound visitors about 13.2%. | Revenue addressable by one company. |
| Direct tourism GDP | IDR 1,138.90tn; 4.78% | BPS TSA direct-contribution measure. | Additive/comparable to broader estimates including indirect effects. |
BPS published August data on 1 October: 1.60m inbound arrivals, 104.30m domestic trips and 52.52% star-hotel occupancy, superseding July at the report cut-off. [4]
Commercial implication: Domestic products depend on local travel frequency, affordability, urban clusters and seasonality. Chinese outbound products depend on air access, entry information, Mandarin support and local delivery; use distinct acquisition and margin models.
BPS’s 2025 nationality data records about 1.34m arrivals from China, 8.7% of international arrivals and the fourth-largest source market. BPS survey estimates average spend per visit at US$1,213 for China-source visitors versus US$1,267 overall; average stays at 22.50 versus 9.92 days. [2][5][6]
The longer stay alongside slightly lower average spend cautions against treating nationality records as short leisure tours. Business, family visits and longer stays may be mixed in; averages do not describe each traveler or forecast tour revenue.
Dragon Trail surveyed 1,010 mainland Chinese respondents in August 2026: 54% intended outbound travel during Mid-Autumn/National Day; among family travelers, 70% preferred organized options. This is outbound intent, not an Indonesia sample or realized booking data. [7]
Separate leisure, business and family visits. Verify channels, itineraries and per-traveler revenue from actual orders. Test two or three routes against conversion, refunds, delivery cost and repeat purchase.
Leading 2025 gateways were Bali’s Ngurah Rai, Jakarta’s Soekarno–Hatta and Batam, with about 6.908m, 2.761m and 1.594m arrivals, together 73.2% of national arrivals. Entry records do not show final overnight stays. [2]
| Gateway / extension | Product tests | Delivery checks |
|---|---|---|
| Bali | Leisure, celebrations, wellness, islands and culture; segment by traveler and hotel tier. | Peak rooms, transfers, attraction slots, sea conditions and cancellations. |
| Jakarta | MICE, city stopovers and Java culture extensions. | Traffic, scheduling and event-driven room rates. |
| Batam–Bintan | Singapore/Malaysia connections, short breaks and island holidays. | Ferries, border transitions and operator responsibility. |
| Yogyakarta–Borobudur, East Java, Lombok, Komodo, Lake Toba, Raja Ampat | Heritage, nature, diving and longer extensions. | Flight buffers, conservation rules, seasonality and medical evacuation. |
The national entry series records 6,907,585 arrivals through Ngurah Rai; BPS Bali’s annual series reports 6,948,754 foreign visitors directly to Bali. These are distinct series, cited separately, not summed or forced to reconcile. [2][8]
Test Bali-only and Jakarta/Yogyakarta plus Bali against source city, flight, trip length and budget. Start with fixed dates, limited hotels and substitute activities.
Sell reliable fulfillment: coordinate Mandarin information and inventory; standardize vehicles, guides, changes, refunds and incident response.
Validate search and content-to-inquiry funnels before packaging transfers, tickets, activities, hotels and day tours as deliverable SKUs.
Offer Chinese channels live inventory, settlement, Mandarin service and group/cancellation terms; test demand without promising volume from nationality totals.
National average spend is not operator revenue. Model net revenue after discounts, refunds, payment fees and tax; lodging and local delivery costs; commissions and a risk reserve. Track margin per traveler, break-even group size, revenue per seat, cancellations, punctuality, complaints and repeat purchase. Stress-test seasons, FX and undersold departures. Scale only when post-refund economics remain positive and partners deliver.
| Phase | Actions | Evidence |
|---|---|---|
| Weeks 1–2 | Choose two profiles and up to three routes; check entry rules, access and seasonality; collect three provider quotes. | Route cards, cost base and backup providers/transit. |
| Weeks 3–6 | Audit DMCs, hotels and activities; test transfers, payment, changes, complaints and inventory. | Service terms, refund rules, Mandarin SOP and emergency contacts. |
| Weeks 7–12 | Run capped sales tests; review inquiry-booking-travel funnel and margin weekly; interview customers and drop-offs. | Results, revised assumptions and scale-or-stop decision. |
Data cut-off: 3 October 2026. August was the latest BPS monthly release; full-year 2026 figures were not yet available. Arrivals and domestic trips are not unique people. Survey expenditure is not a product revenue forecast.
This is general industry research, not legal, tax, investment or operating advice, and it does not certify any operator, DMC, hotel or service provider. Verify definitions, periods and scope before citing; do not convert market totals into company revenue forecasts. Commercial decisions should follow current Indonesian regulations, contracts and professional advice.
Equator Creative Consulting supports Chinese travel companies with destination screening, provider interviews, route-cost analysis and pilot-sales metrics.
See & Book the Diagnostic →Explore market, project and industry research on Indonesia.
Contact details